
Urea (Urine)

Optimal result: 168 – 465 mmol/g creatinine

High levels of urea in the urine may suggest:

- too much protein in the diet
- excessive protein breakdown in the body

Low levels of urea in the urine may suggest:

- malnutrition
- too little protein in the diet
- kidney disease

Urea is the principal nitrogenous waste product of metabolism and is generated from protein breakdown.

Urea is the principal nitrogenous waste product of metabolism and is generated from protein breakdown. It is eliminated from the body almost exclusively by the kidneys in urine.

In a series of five enzymatically controlled reactions, known collectively as the “urea cycle”, toxic ammonia resulting from protein breakdown is converted to non-toxic urea.

In addition to ammonia and the five ”urea cycle” enzymes, endogenous production of urea requires the presence of bicarbonate, aspartate and energy input in the form of adenosine triphosphate (ATP).

Carbon dioxide (CO2) is a secondary product of the urea cycle. Almost all of this urea production occurs in the cells of the liver (hepatocytes); the only other source is the cells of the kidneys.

As might be expected, the rate of urea production is influenced by protein content of diet; low-protein diet is associated with reduced urea production and high-protein diet is associated with increased urea production.

Starvation is, perhaps counterintuitively, associated with increased urea production but this is explained by the increased protein released from muscle tissue breakdown (autolysis) that occurs during starvation to provide an energy source.

A small amount (<10 %) of urea is eliminated via sweat and the gut, but most of the urea produced in the liver is transported in blood to the kidneys where it is eliminated from the body in urine.

Urea (Urine)
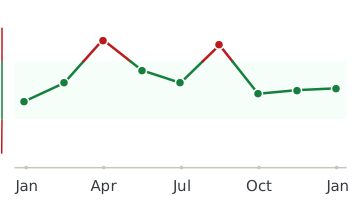
Healthmatters dashboard showing biomarker trend graph

Every lab result you’ve ever had, charted and explained.

Healthmatters is a tracker for your lab results. Upload a report from any lab, any country — every marker charted and explained.

Start with my report →
Beyond Urea (Urine) — 10,000+ markers explained
One Urea (Urine) result tells you where you are. Your history tells you where you’re heading. Upload your past lab reports and see this marker — and every marker on them —every marker charted against your own lab’s ranges.
Start with this report →
Healthmatters timeline preview showing biomarker trends over time
Clinical Sources & References

All our content is backed by peer-reviewed studies, academic research, and trusted medical sources. We’re committed to accuracy and transparency — see our editorial policy for details.

Article Review Log
Written by Healthmatters Editorial Team
Healthmatters Lifetime Plan

Pay $250. Track your health forever

One payment. No renewals. Yours for life.

10,000+ biomarkers explained · trends over time

See other plans →
Secure checkout via Stripe · GDPR & HIPAA
We accept results from any lab
LabCorp Quest Diagnostics Genova Diagnostics DUTCH Test Doctor's Data Vibrant America ZRT Laboratory Cyrex Labs + any other lab

What members are saying

★★★★★ 10,000+ happy members
★★★★★

"Watching my numbers move over the years — instead of forgetting last time's results — completely changed how I manage my health."

Daniel
Member since 2022
★★★★★

"Living across several countries made keeping my lab results organized a real challenge. Healthmatters brought my results from the USA, Spain, and Germany together — 20 years of history, with long-term trends instead of scattered reports."

Ben
Member since 2021 · tracks across countries
★★★★★

"Standard lab ranges are too wide for how I practice — 'normal' isn't optimal. I set my own bands, so a client sees yellow before a marker goes officially out of range. That's the conversation I want to be having."

Dr. Alexandra
Functional medicine · 6 yrs on Pro