
Percent of a+b

Optimal result: 50 – 100 %

A low percentage of A+B motility in a semen analysis indicates a reduced proportion of sperm that exhibit progressive motility (category A) and non-progressive motility (category B). Here's what this signifies:

→ Reduced Motility: A low A+B percentage suggests that a smaller number of sperm in the sample are effectively moving. This can impact the sperm's ability to reach and fertilize an egg during natural conception.

→ Fertility Implications: Sperm motility is a crucial factor in fertility. A low A+B percentage may reduce the chances of successful fertilization, as sperm need to swim effectively to reach the egg.

→ Possible Causes: Various factors can contribute to low motility, including hormonal imbalances, genetic factors, infections, lifestyle choices (such as smoking and excessive alcohol consumption), and certain medical conditions.

→ Consultation: If a semen analysis shows a low A+B motility percentage, it is advisable to consult a healthcare professional or a fertility specialist. They can assess the specific situation, identify potential underlying causes, and recommend appropriate interventions or treatments.

→ Assisted Reproductive Techniques: In cases of severely low motility, assisted reproductive techniques such as intrauterine insemination (IUI) or in vitro fertilization (IVF) with intracytoplasmic sperm injection (ICSI) may be considered to improve the chances of conception.

It's important to note that while low motility can be a contributing factor to fertility issues, it does not necessarily mean infertility. Fertility can still be achieved, but it may require specific interventions and strategies to overcome the motility challenges. Consulting with a healthcare professional is crucial for personalized guidance.

The percentage of A+B motility in semen analysis is a crucial indicator of sperm's ability to effectively move and play a role in natural conception. Higher percentages are generally associated with better fertility outcomes.

The term "percent of A+B" in semen analysis refers to the combined percentage of sperm that exhibit progressive motility (category A) and non-progressive motility (category B). Here's what this signifies:

  1. Category A (Progressive Motility): Sperm categorized as A are those that demonstrate the highest level of motility. These sperm move forward in a straight line or in a large circle, which is considered the most effective movement for fertilization.

  2. Category B (Non-Progressive Motility): Sperm categorized as B have non-progressive motility. They may move, but their movement is not considered efficient for fertilization. This category includes sperm with any type of movement that is not in a straight line or large circle.

  3. Significance: The percentage of A+B provides important information about the overall motility of sperm in a semen sample. Higher percentages of A+B indicate better sperm motility, which is essential for sperm to reach and fertilize the egg during natural conception.

  4. Reference Values: In a standard semen analysis, it is desirable for a significant proportion of sperm to fall into the A+B category. Reference values can vary, but a common benchmark is that more than 50% of sperm should have A+B motility for normal fertility.

  5. Clinical Assessment: Sperm motility, including the A+B category, is one of the parameters assessed during a semen analysis to evaluate male fertility. Abnormalities in this category can contribute to fertility issues.

  6. Assisted Reproductive Techniques: In cases where the percentage of A+B motility is low, assisted reproductive techniques like intrauterine insemination (IUI) or in vitro fertilization (IVF) with intracytoplasmic sperm injection (ICSI) may be recommended to overcome fertility challenges.

Percent of a+b
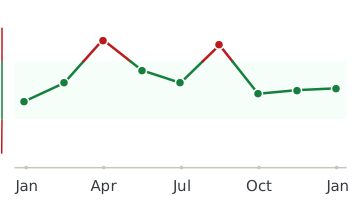
Healthmatters dashboard showing biomarker trend graph

Every lab result you’ve ever had, charted and explained.

Healthmatters is a tracker for your lab results. Upload a report from any lab, any country — every marker charted and explained.

Start with my report →
Beyond Percent of a+b — 10,000+ markers explained
One Percent of a+b result tells you where you are. Your history tells you where you’re heading. Upload your past lab reports and see this marker — and every marker on them —every marker charted against your own lab’s ranges.
Start with this report →
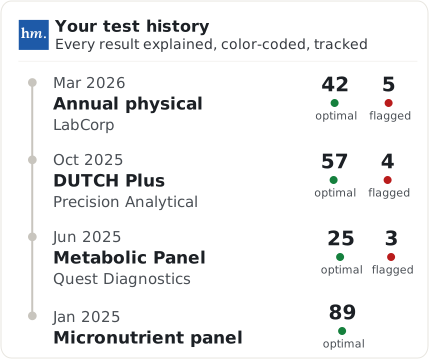
Healthmatters timeline preview showing biomarker trends over time
Clinical Sources & References

All our content is backed by peer-reviewed studies, academic research, and trusted medical sources. We’re committed to accuracy and transparency — see our editorial policy for details.

Article Review Log
Written by Healthmatters Editorial Team
Healthmatters Lifetime Plan

Pay $250. Track your health forever

One payment. No renewals. Yours for life.

10,000+ biomarkers explained · trends over time

See other plans →
Secure checkout via Stripe · GDPR & HIPAA
We accept results from any lab
LabCorp Quest Diagnostics Genova Diagnostics DUTCH Test Doctor's Data Vibrant America ZRT Laboratory Cyrex Labs + any other lab

What members are saying

★★★★★ 10,000+ happy members
★★★★★

"Watching my numbers move over the years — instead of forgetting last time's results — completely changed how I manage my health."

Daniel
Member since 2022
★★★★★

"Living across several countries made keeping my lab results organized a real challenge. Healthmatters brought my results from the USA, Spain, and Germany together — 20 years of history, with long-term trends instead of scattered reports."

Ben
Member since 2021 · tracks across countries
★★★★★

"Standard lab ranges are too wide for how I practice — 'normal' isn't optimal. I set my own bands, so a client sees yellow before a marker goes officially out of range. That's the conversation I want to be having."

Dr. Alexandra
Functional medicine · 6 yrs on Pro