
Lead

Optimal result: 0 – 1.4 ug/g creat

PHYSIOLOGIC EFFECTS:

Mainly taken into the kidney, liver, and other soft tissues such as the heart and brain. However, lead in the skeleton is the major body fraction. The nervous system is a vulnerable target of lead toxicity.

Binds to sulfhydryl groups and amide groups of enzymes, diminishing their activity. This enzymatic inhibition can be seen in heme synthesis, neurotransmitter metabolism, and other sodium- dependent processes.

Produces reactive oxygen species, and competes with metallic cations for binding sites, altering the transport of cations such as calcium and interferes with calcium-dependent processes.

Lead replaces zinc on heme enzymes, and inhibits the enzyme needed to incorporate iron into the hemoglobin molecule by replacing iron. Copper and iron supplementation have been used to counter these heme synthesis effects.

Whole blood lead levels estimate recent exposure to lead, but it is also in equilibrium with bone lead stores.

CLINICAL SIGNIFICANCE:

Headache, poor attention span, irritability, memory loss, and weakness are early CNS symptoms of exposure.

Reproductive effects, GI diseases, anemia, kidney damage, and adverse effects on vitamin D metabolism are also seen.

The CDC provides recommendations for follow-up and case management of children based on confirmed whole blood lead levels beginning at levels of 5 mcg/dL.

There are guidelines with specific cut-points for adults at risk for occupational lead exposure and for lead-exposed adults in general.

Urine lead is less validated than blood lead levels as a biomarker of external exposure or predictor of health effects.

Found naturally in soil. More often found in fossil fuels, gasoline/exhaust, manufacturing, lead-acid batteries, ammunitions, metal solder and pipes, X-ray shields, paint, glass, pigments, and sheet lead.

SOURCES:

Found naturally in soil. More often found in fossil fuels, gasoline/exhaust, manufacturing, lead-acid batteries, ammunitions, metal solder and pipes, X-ray shields, paint, glass, pigments, and sheet lead.

NUTRIENT INTERACTIONS:

Iron and lead share a common transporter; therefore, iron deficiency increases lead absorption.

There is some evidence that higher amounts of dietary calcium are associated with lower blood lead levels.

Calcium and phosphorus supplementation decreases lead absorption and retention.

Selenium has been useful as an adjunct in chelation in lead intoxication.

Zinc deficiency enhances lead absorption and lead increases zinc excretion. Zinc supplementation decreases tissue lead accumulation.

Vitamin D increases lead absorption.

References:

- Yedjou CG, Patlolla AK, Sutton DJ. Heavy Metals Toxicity and the Environment Paul B Tchounwou. Published in final edited form as: EXS. 2012;3:133-164.

- Kordas K, Lonnerdal B, Stoltzfus RJ. Interactions between Nutrition and Environmental Exposures: Effects on Health Outcomes in Women and Children. J Nutr. 2007;137(12):2794-2797.

- Schwalfenberg GK, Genuis SJ. Vitamin D, Essential Minerals, and Toxic Elements: Exploring Interactions between Nutrients and Toxicants in Clinical Medicine. ScientificWorldJournal. 2015;2015:318595-318595.

- Goyer RA. Toxic and essential metal interactions. Ann Rev Nutr. 1997;17(1):37-50.

- Flora G, Gupta D, Tiwari A. Toxicity of lead: a review with recent updates. Interdiscip Toxicol. 2012;5(2):47-58.

- AOEC. Medical Management Guidelines for Lead-Exposed Adults. 2007. http://www.aoec.org/documents/positions/ MMG_FINAL.pdf. Accessed 2020.

- CDC. Recommended Actions Based on Blood Lead Level. Childhood Lead Poisoning Prevention 2020; https://www.cdc.gov/ nceh/lead/advisory/acclpp/actions-blls.htm, 2020.

- Kosnett MJ, Wedeen RP, Rothenberg SJ, et al. Recommendations for medical management of adult lead exposure. Environ HealthPerspect.2007;115(3):463-471.

Lead
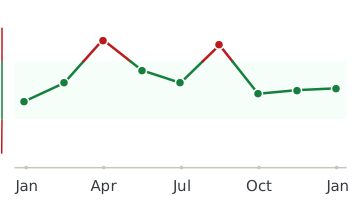
Healthmatters dashboard showing biomarker trend graph

Every lab result you’ve ever had, charted and explained.

Healthmatters is a tracker for your lab results. Upload a report from any lab, any country — every marker charted and explained.

Start with my report →
Beyond Lead — 10,000+ markers explained
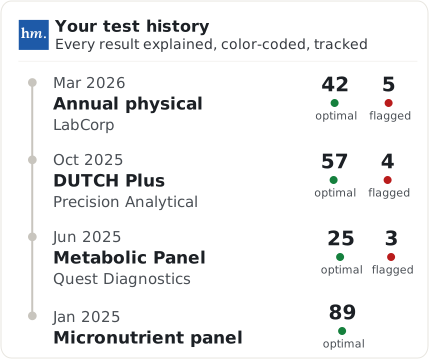
One Lead result tells you where you are. Your history tells you where you’re heading. Upload your past lab reports and see this marker — and every marker on them —every marker charted against your own lab’s ranges.
Start with this report →
Healthmatters timeline preview showing biomarker trends over time
Clinical Sources & References

All our content is backed by peer-reviewed studies, academic research, and trusted medical sources. We’re committed to accuracy and transparency — see our editorial policy for details.

Article Review Log
Written by Healthmatters Editorial Team
Healthmatters Lifetime Plan

Pay $250. Track your health forever

One payment. No renewals. Yours for life.

10,000+ biomarkers explained · trends over time

See other plans →
Secure checkout via Stripe · GDPR & HIPAA
We accept results from any lab
LabCorp Quest Diagnostics Genova Diagnostics DUTCH Test Doctor's Data Vibrant America ZRT Laboratory Cyrex Labs + any other lab

What members are saying

★★★★★ 10,000+ happy members
★★★★★

"Watching my numbers move over the years — instead of forgetting last time's results — completely changed how I manage my health."

Daniel
Member since 2022
★★★★★

"Living across several countries made keeping my lab results organized a real challenge. Healthmatters brought my results from the USA, Spain, and Germany together — 20 years of history, with long-term trends instead of scattered reports."

Ben
Member since 2021 · tracks across countries
★★★★★

"Standard lab ranges are too wide for how I practice — 'normal' isn't optimal. I set my own bands, so a client sees yellow before a marker goes officially out of range. That's the conversation I want to be having."

Dr. Alexandra
Functional medicine · 6 yrs on Pro