
Glutaric (Females Under Age 13)

Optimal result: 0 – 1.1 mmol/mol creatinine

Elevation indicates riboflavin (vitamin B2) deficiency. Other possible factors include fatty acid oxidation defects, and metabolic effects of valproic acid (Depakene), or celiac disease. The probability of a genetic disease is higher with very high values. The use of dietary supplements containing riboflavin and coenzyme Q10 may improve clinical symptoms. This compound may be elevated in about 10% of children with autism.

Possible causes:

- Low B2

- Inborn error of metabolism

- Associated with CETP genetic polymorphism

Additional investigations:

- Red blood cell B2

- Genetic Diagnostic Testing

Treatment considerations:

- Supplement B2

- Consider mitochondrial support nutrients (e.g. CoQ10)

Glutaric acid is made from lysine & tryptophan via alphaketo-adipic acid.

- Elevated in the genetic diseases glutaric academia types I and II.
- Moderate increases may be due to deficiencies in riboflavin and coenzyme Q10, or celiac disease.
- Moderate increases are common in autism possibly due to defective vitamin absorption or microbial production in the GI tract.

Elevation indicates riboflavin deficiency (vitamin B2), a common factor in moderate urinary increases of glutaric acid.

Other possible factors include:

- fatty acid oxidation defects

- metabolic effects of valproic acid (Depakene),

- or celiac disease.

The probability of a genetic disease is higher with very high values.

The use of dietary supplements containing riboflavin and coenzyme Q10 may improve clinical symptoms.

This compound may be elevated in about 10% of children with autism.

Glutaric (Females Under Age 13)
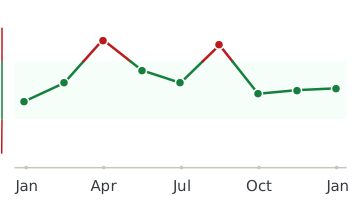
Healthmatters dashboard showing biomarker trend graph

Every lab result you’ve ever had, charted and explained.

Healthmatters is a tracker for your lab results. Upload a report from any lab, any country — every marker charted and explained.

Start with my report →
Beyond Glutaric (Females Under Age 13) — 10,000+ markers explained
One Glutaric (Females Under Age 13) result tells you where you are. Your history tells you where you’re heading. Upload your past lab reports and see this marker — and every marker on them —every marker charted against your own lab’s ranges.
Start with this report →
Healthmatters timeline preview showing biomarker trends over time
Clinical Sources & References

All our content is backed by peer-reviewed studies, academic research, and trusted medical sources. We’re committed to accuracy and transparency — see our editorial policy for details.

Article Review Log
Written by Healthmatters Editorial Team
Healthmatters Lifetime Plan

Pay $250. Track your health forever

One payment. No renewals. Yours for life.

10,000+ biomarkers explained · trends over time

See other plans →
Secure checkout via Stripe · GDPR & HIPAA
We accept results from any lab
LabCorp Quest Diagnostics Genova Diagnostics DUTCH Test Doctor's Data Vibrant America ZRT Laboratory Cyrex Labs + any other lab

What members are saying

★★★★★ 10,000+ happy members
★★★★★

"Watching my numbers move over the years — instead of forgetting last time's results — completely changed how I manage my health."

Daniel
Member since 2022
★★★★★

"Living across several countries made keeping my lab results organized a real challenge. Healthmatters brought my results from the USA, Spain, and Germany together — 20 years of history, with long-term trends instead of scattered reports."

Ben
Member since 2021 · tracks across countries
★★★★★

"Standard lab ranges are too wide for how I practice — 'normal' isn't optimal. I set my own bands, so a client sees yellow before a marker goes officially out of range. That's the conversation I want to be having."

Dr. Alexandra
Functional medicine · 6 yrs on Pro