
Cadmium

Optimal result: 0 – 0.64 ug/g creat

PHYSIOLOGIC EFFECTS:

Cadmium accumulates in the liver and kidneys and has a long half-life (17-30 years). The renal and skeletal systems are the main targets of Cadmium toxicity. Urinary cadmium reflects integrated exposure over time and body burden. Urinary levels do not rise significantly after acute exposure. Elevated blood cadmium levels confirm recent acute exposure.

CLINICAL SIGNIFICANCE:

Renal tubular toxicity, decreased bone density with increased bone turnover and fractures.

Chronic inhalation exposure is associated with emphysema. Acute oral ingestion leads to abdominal pain, nausea, vomiting, muscle cramps, and GI tract erosions.

SOURCES:

Found in food such as shellfish, leafy vegetables, rice, cereals, cocoa butter, dried seaweed, and legumes. Also present in nickel cadmium batteries, cigarette smoke (including second-hand smoke), insecticides, fertilizer, motor oil, emissions and exhaust. Drinking water, air, and occupational exposures are also seen.

NUTRIENT INTERACTIONS:

Iron deficiency is associated with higher cadmium burden and absorption of cadmium may increase during very early stages of iron deficiency. Zinc deficiency is associated with an increase in Cadmium, as a result of the antagonistic relationship between the elements.

Dietary cadmium inhibits GI absorption of calcium and interferes with calcium and vitamin D metabolism. Low dietary calcium stimulates synthesis of calcium- binding protein which enhances Cadmium absorption.

SOURCES:

Found in food such as shellfish, leafy vegetables, rice, cereals, cocoa butter, dried seaweed, and legumes. Also present in nickel cadmium batteries, cigarette smoke (including second-hand smoke), insecticides, fertilizer, motor oil, emissions and exhaust. Drinking water, air, and occupational exposures are also seen.

NUTRIENT INTERACTIONS:

Iron deficiency is associated with higher cadmium burden and absorption of cadmium may increase during very early stages of iron deficiency. Zinc deficiency is associated with an increase in Cadmium, as a result of the antagonistic relationship between the elements.

Dietary cadmium inhibits GI absorption of calcium and interferes with calcium and vitamin D metabolism. Low dietary calcium stimulates synthesis of calcium- binding protein which enhances Cadmium absorption.

References:

- Yedjou CG, Patlolla AK, Sutton DJ. Heavy Metals Toxicity and the Environment Paul B Tchounwou. Published in final edited form as: EXS. 2012;3:133-164.

- Kordas K, Loonnerdal B, Stoltzfus RJ. Interactions between Nutrition and Environmental Exposures: Effects on Health Outcomes in Women and Children. J Nutr. 2007;137(12):2794-2797.

- Afridi HI, Kazi TG, Kazi NG, et al. Evaluation of cadmium, lead, nickel and zinc status in biological samples of smokers and nonsmokers hypertensive patients. J Hum Hypertens. 2010;24(1):34-43.

- ATSDR. Cadmium Toxicity Clinical Assessment - Laboratory Tests. Environmental Health and Medicine Education 2008; https://www.atsdr.cdc.gov/csem/csem.asp?csem=6&po=15 2020.

- Lauwerys R, Buchet J, Roels H. The relationship between cadmium exposure or body burden and the concentration of cadmium in blood and urine in man. Int Arch Occup Environ health. 1976;36(4):275-285.

- Adams SV, Newcomb PA. Cadmium blood and urine concentrations as measures of exposure: NHANES 1999-2010. J Expo Sci Environ Epidemiol. 2014;24(2):163-170.

- Goyer RA. Toxic and essential metal interactions. Ann Rev Nutr. 1997;17(1):37-50.

Cadmium
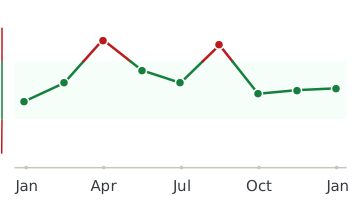
Healthmatters dashboard showing biomarker trend graph

Every lab result you’ve ever had, charted and explained.

Healthmatters is a tracker for your lab results. Upload a report from any lab, any country — every marker charted and explained.

Start with my report →
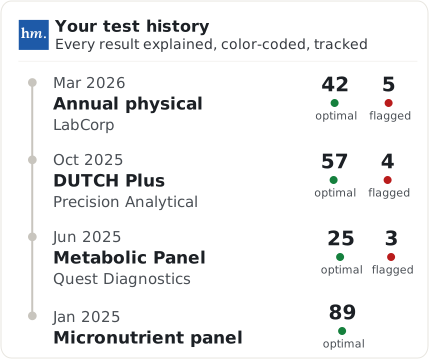
Beyond Cadmium — 10,000+ markers explained
One Cadmium result tells you where you are. Your history tells you where you’re heading. Upload your past lab reports and see this marker — and every marker on them —every marker charted against your own lab’s ranges.
Start with this report →
Healthmatters timeline preview showing biomarker trends over time
Clinical Sources & References

All our content is backed by peer-reviewed studies, academic research, and trusted medical sources. We’re committed to accuracy and transparency — see our editorial policy for details.

Article Review Log
Written by Healthmatters Editorial Team
Healthmatters Lifetime Plan

Pay $250. Track your health forever

One payment. No renewals. Yours for life.

10,000+ biomarkers explained · trends over time

See other plans →
Secure checkout via Stripe · GDPR & HIPAA
We accept results from any lab
LabCorp Quest Diagnostics Genova Diagnostics DUTCH Test Doctor's Data Vibrant America ZRT Laboratory Cyrex Labs + any other lab

What members are saying

★★★★★ 10,000+ happy members
★★★★★

"Watching my numbers move over the years — instead of forgetting last time's results — completely changed how I manage my health."

Daniel
Member since 2022
★★★★★

"Living across several countries made keeping my lab results organized a real challenge. Healthmatters brought my results from the USA, Spain, and Germany together — 20 years of history, with long-term trends instead of scattered reports."

Ben
Member since 2021 · tracks across countries
★★★★★

"Standard lab ranges are too wide for how I practice — 'normal' isn't optimal. I set my own bands, so a client sees yellow before a marker goes officially out of range. That's the conversation I want to be having."

Dr. Alexandra
Functional medicine · 6 yrs on Pro