
AA / EPA (20:4 n6 / 20:5 n3)

Optimal result: 10 – 86 Ratio

EPA (n3) and AA (n6) both compete for use of the delta-5- desaturase enzyme to be synthesized. Increased dietary intake of animal fats alters fatty acid metabolism in favor of inflammation. There are many chronic diseases associated with elevations of this ratio including cardiovascular disease, mood disorders, and cancer. Increasing dietary intake of fish oils, or omega-3 fatty acid containing foods such as flax, chia, oily fish, or walnuts, can shift delta-5-desaturase activity toward the metabolism of the more beneficial n-3 metabolites.

Decreasing intake of animal fats is also recommended.

The higher the AA/EPA ratio, the higher are the levels of cellular inflammation.

An AA/EPA ratio of 1.5 is considered to be ideal, since this is the ratio found in the Japanese population having the greatest longevity and the lowest incidence of cardiovascular disease.

A lower AA/EPA ratio indicates a better balance of “good” and “bad” eicosanoids in your body. The average AA/EPA of Americans is approximately 11, and for patients with inflammatory conditions and neurological disorders, the AA/EPA ratio will be in excess of 20.

EPA (n3) and AA (n6) both compete for use of the delta-5- desaturase enzyme to be synthesized. Increased dietary intake of animal fats alters fatty acid metabolism in favor of inflammation. There are many chronic diseases associated with elevations of this ratio including cardiovascular disease, mood disorders, and cancer. Increasing dietary intake of fish oils, or omega-3 fatty acid containing foods such as flax, chia, oily fish, or walnuts, can shift delta-5-desaturase activity toward the metabolism of the more beneficial n-3 metabolites.

Decreasing intake of animal fats is also recommended.

EPA (n3) and AA (n6) both compete for use of the delta-5- desaturase enzyme to be synthesized. Increased dietary intake of animal fats alters fatty acid metabolism in favor of inflammation. There are many chronic diseases associated with elevations of this ratio including cardiovascular disease, mood disorders, and cancer. Increasing dietary intake of fish oils, or omega-3 fatty acid containing foods such as flax, chia, oily fish, or walnuts, can shift delta-5-desaturase activity toward the metabolism of the more beneficial n-3 metabolites.

Decreasing intake of animal fats is also recommended.

References:

- Tutino V, De Nunzio V, Caruso MG, et al. Elevated aa/epa ratio represents an inflammatory biomarker in tumor tissue of metastatic colorectal cancer patients. International Journal of Molecular Sciences. 2019;20(8):2050.

- Rizzo AM, Corsetto PA, Montorfano G, et al. Comparison between the AA/EPA ratio in depressed and non depressed elderly females: omega-3 fatty acid supplementation correlates with improved symptoms but does not change immunological parameters. Nutrition journal. 2012;11(1):82.

- Adams PB, Lawson S, Sanigorski A, Sinclair AJ. Arachidonic acid to eicosapentaenoic acid ratio in blood correlates positively with clinical symptoms of depression. Lipids. 1996;31(1Part2):S157-S161.

- Harris WS, Assaad B, Poston WC. Tissue omega-6/omega-3 fatty acid ratio and risk for coronary artery disease. The American journal of cardiology. 2006;98(4):19-26.

- Rupp H, Wagner D, Rupp T, Schulte L-M, Maisch B. Risk Stratification by the “EPA+ DHA Level” and the “EPA/AA Ratio”. Herz. 2004;29(7):673-685.

- Sorgi PJ, Hallowell EM, Hutchins HL, Sears B. Effects of an open-label pilot study with high-dose EPA/DHA concentrates on plasma phospholipids and behavior in children with attention deficit hyperactivity disorder. Nutrition journal. 2007;6(1):16.

AA / EPA (20:4 n6 / 20:5 n3)
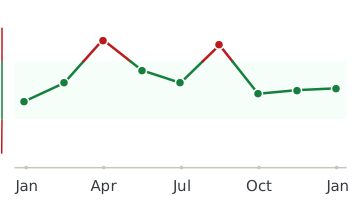
Healthmatters dashboard showing biomarker trend graph

Every lab result you’ve ever had, charted and explained.

Healthmatters is a tracker for your lab results. Upload a report from any lab, any country — every marker charted and explained.

Start with my report →
Beyond AA / EPA (20:4 n6 / 20:5 n3) — 10,000+ markers explained
One AA / EPA (20:4 n6 / 20:5 n3) result tells you where you are. Your history tells you where you’re heading. Upload your past lab reports and see this marker — and every marker on them —every marker charted against your own lab’s ranges.
Start with this report →
Healthmatters timeline preview showing biomarker trends over time
Clinical Sources & References

All our content is backed by peer-reviewed studies, academic research, and trusted medical sources. We’re committed to accuracy and transparency — see our editorial policy for details.

Article Review Log
Written by Healthmatters Editorial Team
Healthmatters Lifetime Plan

Pay $250. Track your health forever

One payment. No renewals. Yours for life.

10,000+ biomarkers explained · trends over time

See other plans →
Secure checkout via Stripe · GDPR & HIPAA
We accept results from any lab
LabCorp Quest Diagnostics Genova Diagnostics DUTCH Test Doctor's Data Vibrant America ZRT Laboratory Cyrex Labs + any other lab

What members are saying

★★★★★ 10,000+ happy members
★★★★★

"Watching my numbers move over the years — instead of forgetting last time's results — completely changed how I manage my health."

Daniel
Member since 2022
★★★★★

"Living across several countries made keeping my lab results organized a real challenge. Healthmatters brought my results from the USA, Spain, and Germany together — 20 years of history, with long-term trends instead of scattered reports."

Ben
Member since 2021 · tracks across countries
★★★★★

"Standard lab ranges are too wide for how I practice — 'normal' isn't optimal. I set my own bands, so a client sees yellow before a marker goes officially out of range. That's the conversation I want to be having."

Dr. Alexandra
Functional medicine · 6 yrs on Pro